The Volumes Report Explained
With each job we provide a detailed volumes report and a site label map that shows the report areas labeled in plan view.
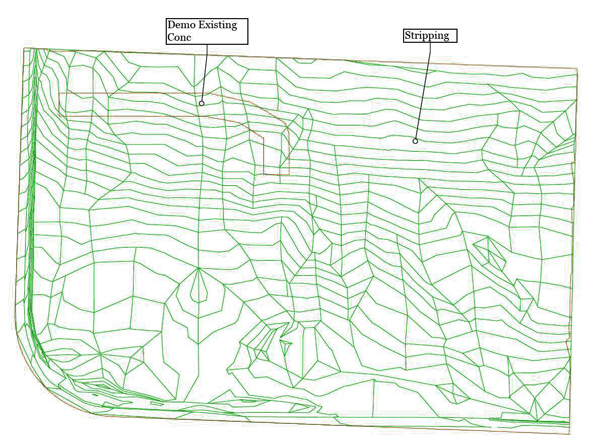
If needed we will provide a stripping/demo map showing those areas in plan view.
Examples of these can be seen at the bottom of the page.
Part 2 - Cut Fill Report
Part 3 - Stripping and Demo
Part 4 - Sectional Quantities
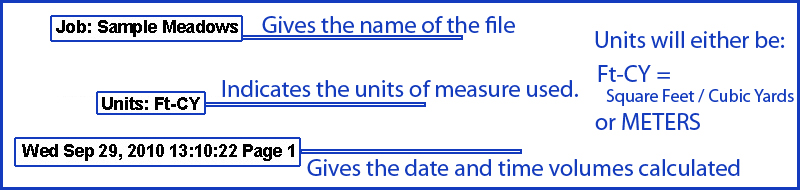
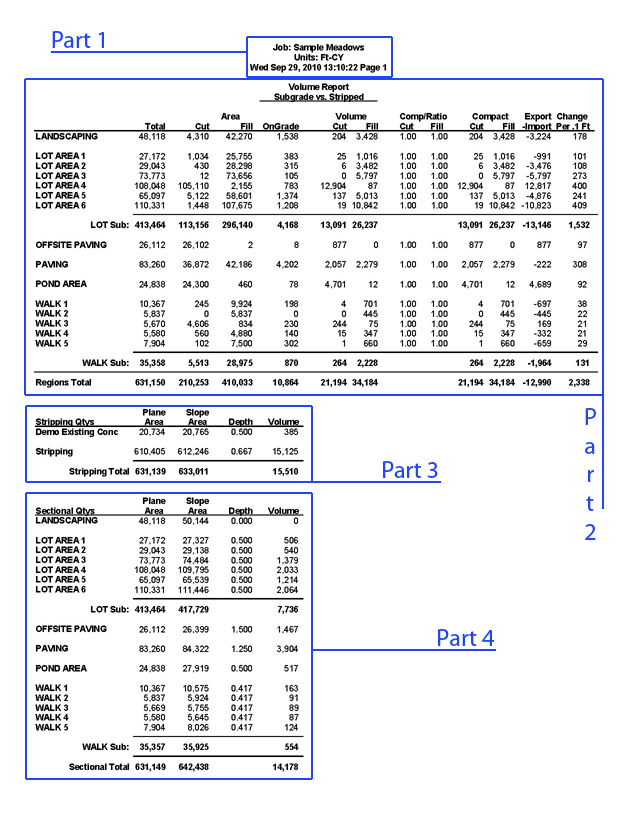
Part 1 - Job Info
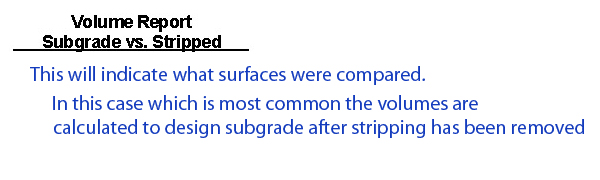
This section of the volumes report gives basic information about the job. The name of the job is followed by the units of measure used to calculate the areas and volumes. The units will either be Ft-CY, to indicate that areas will be in square feet and volumes are cubic yards, or the units will be labeled M to indicate that areas are in square maters and volumes are cubic meters.
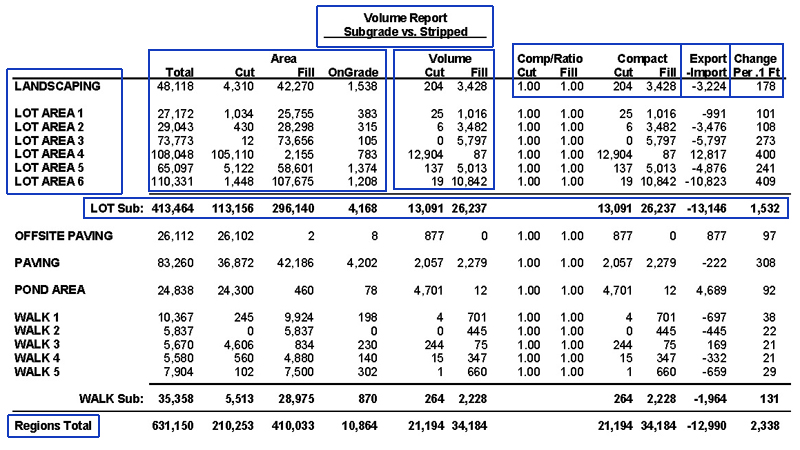
Part 2 - Cut Fill Volumes and Areas
Here is where you will find the meat of the cut fill volumes.
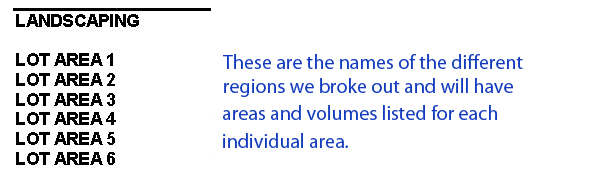
The site will generally be divided into different regions, such as sidewalk,
paving and landscape areas. All of these regions will have a breakdown of
areas and volumes associated with them.
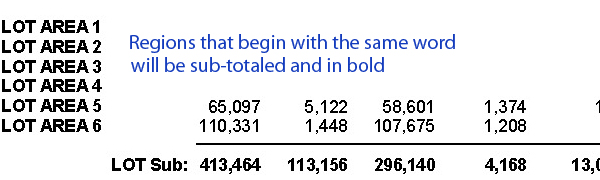
The region names are listed in the first column on the left in alphabetical order
and any regions that start with the same word, such as Walk 1, Walk 2 etc.,
will be subtotaled on an indented line in bold.
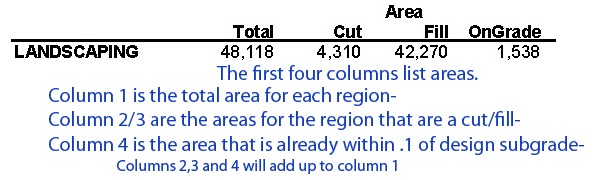
The next four columns will give areas for each region. This first column is
the total area for the region. The next three columns break that total
area down into areas that are cut area, fill areas and areas that are within .1
of design subgrade(On grade). These areas will be in either Square Feet or Square Meters.
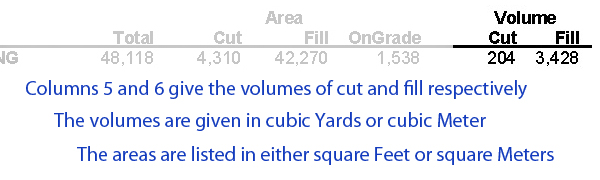
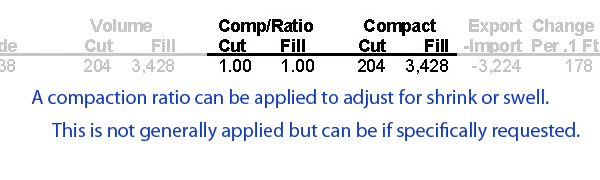
The next two columns give the cut and fill volumes. These volumes are volumetric
(or bank volumes) that do not reflect any sort of shrink or swell. If we were
to apply any sort of calculation to account for shrink or swell this would
be shown in the next four columns. Columns 8 and 9 are labeled Comp/Ratio and would show
as a decimal number any shrink or swell factor that was applied. The next two columns
will give the adjusted volumes if a compaction factor has been applied.
We rarely apply adjustments for shrink or swell since we are not soils engineers
and can't make assumptions as to what factor to apply.
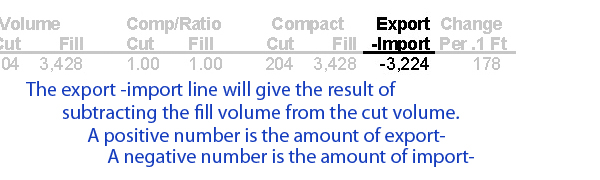
The second to last column labeled Export -Import will give the amount of import or export.
The number given is either cubic yards or Meters depending on the job and if it is
a negative number is the amount of import needed. If it is a positive number then
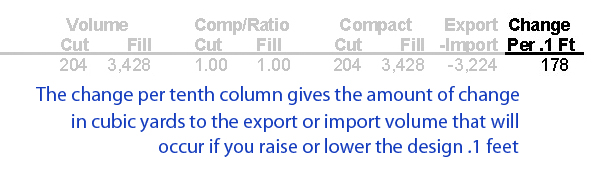
it is the amount of export. The last column shows the approximate amount that the
Export import number will change in Cubic Yards/Meters if you are to raise or lower that
region by .1 Feet/Meters.
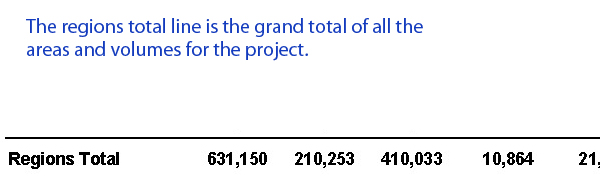
At the bottom of this section will be a line that gives the total for all of the regions combined.
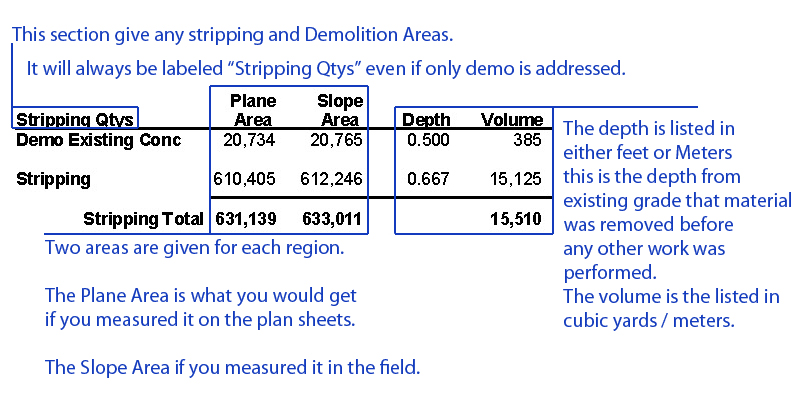
Part 3 - Stripping and Demo Volumes and Areas
This part of the volumes report will show any stripping or demolition that
was calculated for the job. In the software that we use the section is
labeled "Stripping Qtys" but also includes any demolition that is addressed.
 The names of the areas that were addressed are in bold in the first column.
If needed for the job a stripping/demo map will be included. An example is shown at the right
and can be clicked on for a larger view
The names of the areas that were addressed are in bold in the first column.
If needed for the job a stripping/demo map will be included. An example is shown at the right
and can be clicked on for a larger view
The names of the areas are followed by two columns
giving the area for each in two ways.
The plane area or the area that you would get were you to
measure the area on the plan sheets.
The slope area or the area that you would get were you to measure
the area on site taking the slope of the ground into account.
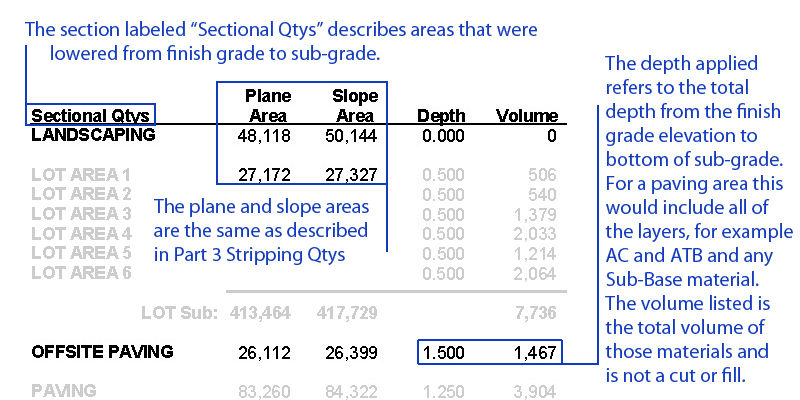
Part 4 - Sectional Quantities
The sectional quantities area gives information on what depths were applied to
the design elevations to bring the job to sub-grade for the volumes to be calculated.
The information is the same as that given for the stripping areas.
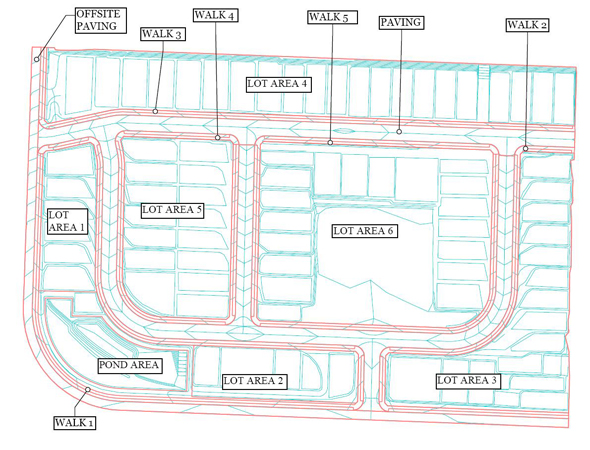 Included with almost all jobs is a site label map that shows where these
sectional areas are.
Included with almost all jobs is a site label map that shows where these
sectional areas are.
The depths applied to these areas are the total depth needed to reach
sub-grade from finish grade.
For example if a paving area is shown in the plans to have 6 inches of
aggregate base with 3 inches of ATB on top of that
with 3 inches of AC paving on top we would apply a depth of 12 inches or
1.00 feet as it is shown on the volumes report. If you want to calculate
the amount of ATB you would use the slope area given to find that.